")
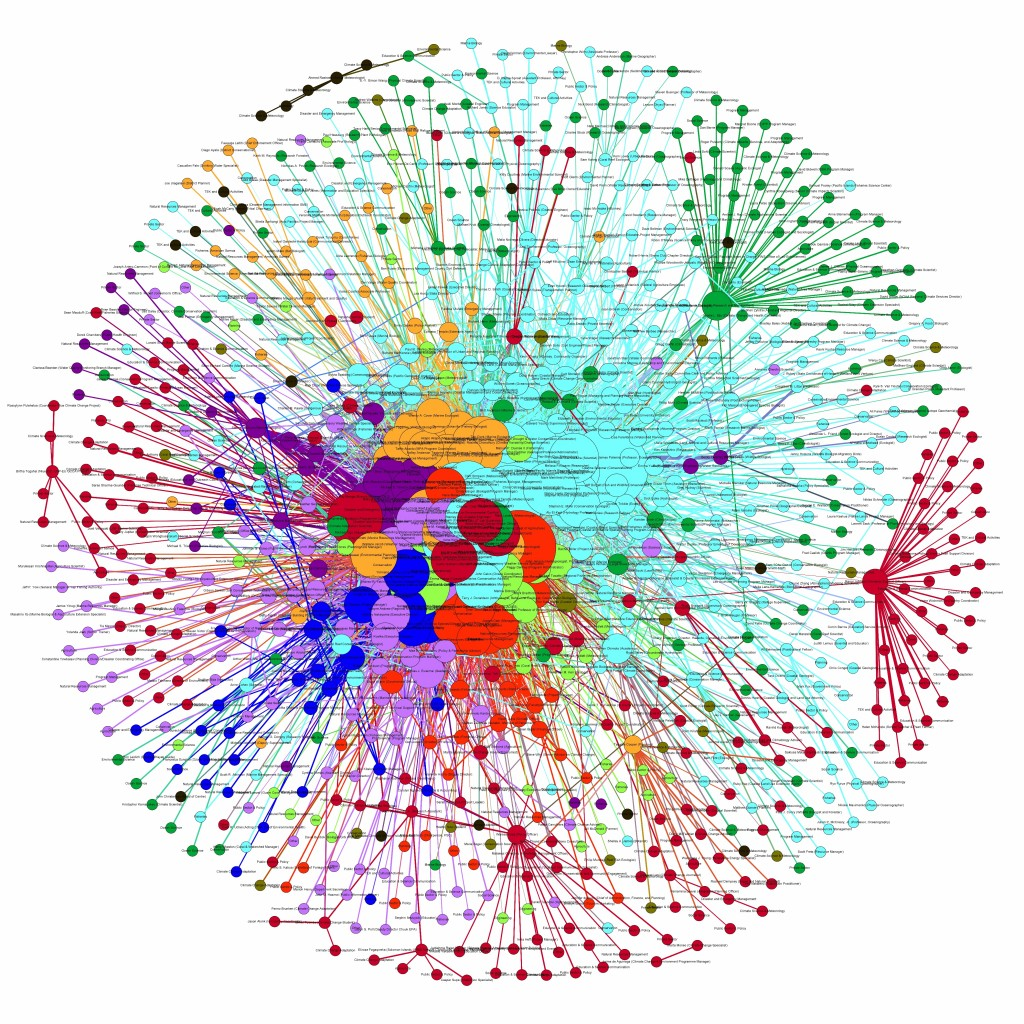
In the intricate world of organizational dynamics, understanding the undercurrents of relationships and information flow is not just insightful – it’s essential for effective risk management. Welcome to our deep dive into the world of Social Network Analysis (SNA) and its pivotal role in enhancing Organizational Risk Analysis.
At first glance, the ties that bind an organization – from the overt hierarchies to the subtle, informal networks – might seem straightforward. However, beneath the surface lies a complex web of interactions and influences that traditional risk analysis methods often overlook. This is where Social Network Analysis, a powerful and nuanced tool, steps in.
Social Network Analysis offers a unique lens to view and interpret the relationships and interactions within an organization. By meticulously mapping out these networks, SNA provides a multidimensional understanding of how information, influence, and decision-making processes flow through an organization. This insight is invaluable in identifying potential risks, hidden vulnerabilities, and even opportunities for strengthening the organizational structure.
In this blog, we will explore the intricacies of Social Network Analysis, its application in organizational risk assessment, and how it can reveal insights that traditional methods might miss. From identifying key influencers and bottlenecks in information flow to understanding the impact of social structures on organizational resilience, we’ll cover the spectrum of SNA’s capabilities in the context of risk analysis.
Join us as we uncover the invisible networks that shape organizational dynamics and learn how leveraging these insights can significantly enhance risk management strategies.
Contents
01.Introduction to Organization. 4
Retail sector of John Keells Holdings. 4
Summary of the Working Department. 5
Executive Leadership within John Keells Holdings PLC. 5
Information Technology Department. 6
Commercial Department (Category management Department) 8
Functions (Tasks) Of the Departments. 11
02.Organizational Reporting Structure. 13
Agent x Agent Formal nodes. 14
Agent x Agent Informal nodes. 15
Agent x Agent Formal Matrix. 18
Agent Formal x Agent Informal Matrix. 21
05.Visualization of 4 networks and combined meta network. 31
Agent x Agent Formal Network. 32
Agent x Agent Informal Network. 32
06.Node-Wise (Agent) Measurements of Total degree, Closeness & Betweenness. 34
07.Interpretation and Explanation of insights. 37
Interpretations from Visualizations. 37
Explanations from Node-Wise Measures. 39
08.Risks And Opportunities within the department. 41
Recommendations to Mitigate Risks. 52
Recommendations to Capitalize on Opportunities. 53
01.Introduction to Organization.
Jhon Keells Holdings PLC
John Keells Holdings PLC (JKH) is a prominent conglomerate in Sri Lanka with diverse business interests. They are involved in various sectors, including hospitality, logistics, IT solutions, food and beverage manufacturing, retail, financial services, and real estate. JKH operates hotels and resorts in Sri Lanka and the Maldives, provides port and marine fuel services, and manages logistics. They are also engaged in IT services, own a supermarket chain, are active in tea and stock brokering, and offer life insurance and banking services. Furthermore, JKH is known for its global presence, being the first Sri Lankan company to list Global Depository Receipts on the Luxembourg Stock Exchange.
JKH is dedicated to sustainable development and social responsibility, actively participating in the Global Compact, a United Nations-sponsored initiative promoting corporate citizenship. Remarkably, JKH has consistently held the position of the most valuable organization in Sri Lanka since the 1980s.
Retail sector of John Keells Holdings.
Jay Kay Marketing services (Pvt) Ltd is operating the retail sector of Keells which has 75% of the ownership of John Keells holdings.
Jay Kay Marketing services (Pvt) Ltd, the trendsetter in modern organized retailing, manages the “Keells” supermarket chain in the country which consist of 109 outlets island wide which expanded throughout 124 locations present and counting.
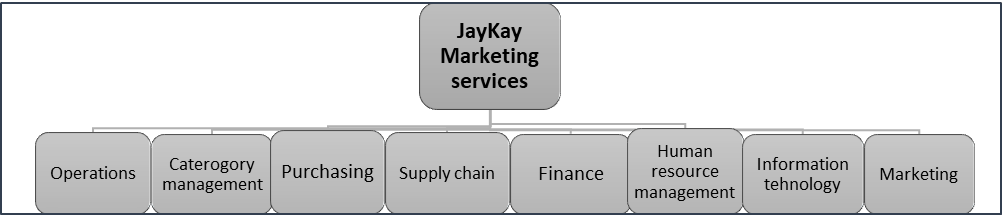
Figure 1.1: Departments in JayKay Marketing services
This report consists of a network analysis of three combined departments which indicates a combination of formal and informal relationships, knowledge and tasks including their reporting structures.
In the retail industry, JayKay Marketing services interact with both suppliers and customers.

Figure 1.2: Collaboration with suppliers and customers.
To enhance the operational efficiency, visibility and transparency, governance and processes always automated through integrated systems where commercial department, Master Data department and Revenue planning department always required the assistance of Information Technology Department.
Summary of the Working Department.
Executive Leadership within John Keells Holdings PLC
The leadership structure within John Keells Holdings PLC (JKH), a prominent conglomerate organization, is characterized by individuals of exceptional stature and competence.
Chairperson
At the helm of this conglomerate, the distinguished position of Chairperson is held by Mr. Krishan Balendra. As the Chairperson, Mr. Balendra assumes the paramount leadership role, providing strategic guidance and direction to the entire organization.
President of Retail Sector
Within the expansive domain of JKH, the role of President of the Retail Sector is entrusted to Mr. Charitha Subasinghe. In this capacity, Mr. Subasinghe is responsible for overseeing and steering the retail sector, ensuring its alignment with the overarching corporate objectives of JKH.
These notable leaders bring their extensive expertise and visionary leadership to guide JKH in its pursuit of excellence and sustainable growth.
With the supervision of the above two leadership positions, there are three Chief Executive positions arrayed for these departments.
Information Technology Department.
With the supervision of the head of Information Technology, this department plays a crucial role in supporting and enhancing various aspects of the business. Here are some of the key tasks and responsibilities of the IT department in the context of the retail sector of John Keells Holdings
- Point of Sale (POS) Systems Management
The IT department is responsible for managing and maintaining the POS systems used directed to direct stores and outlets. This includes hardware and software management, ensuring that transactions are processed smoothly, and addressing any technical issues promptly.
- Inventory Management
IT systems are essential for tracking and managing inventory levels. The IT department develops and maintains inventory management software (Keells advanced networking Exchange) that helps retailers optimize stock levels, reduce wastage, and ensure products are available when needed.
- E-commerce and Online Sales
In an increasingly digital retail landscape, IT departments are responsible for developing and maintaining e-commerce platforms and websites. They ensure that online sales channels are secure, user-friendly, and can handle high volumes of traffic.
- Customer Relationship Management (CRM)
IT plays a critical role in managing customer data and implementing CRM systems. These systems help employers to analyze customer behavior, tailor marketing campaigns, and improve customer satisfaction and loyalty.
- Supply Chain Management
IT systems are used to optimize supply chain processes, from tracking shipments to managing vendor relationships. This includes using software for demand forecasting, order management, and logistics coordination.
- Data Analytics and Business Intelligence
Retailers rely on IT to collect and analyze data from various sources, including sales transactions, customer interactions, and market trends. Data analytics and business intelligence tools help employers to make informed decisions, identify trends, and respond to changing market conditions.
- Security and Compliance
The IT department is responsible for ensuring the security of customer data, financial transactions, and sensitive business information. This includes implementing security protocols, encryption, and compliance with data protection regulations like GDPR or CCPA.
- Omni-Channel Integration
IT systems are used to create a seamless shopping experience across multiple channels, such as in-store, online, and mobile. This involves integrating various platforms and ensuring that customers can access consistent information and services across all touchpoints.
- Payment Processing
Managing secure and efficient payment processing systems is a critical task for the IT department. This includes handling credit card transactions, digital wallets, and other payment methods while maintaining compliance with payment industry standards.
- Technology Innovation
Staying abreast of emerging technologies, such as AI, machine learning, and IoT, is essential in the retail industry. The IT department evaluates how these technologies can be leveraged to improve customer experiences, operational efficiency, and competitive advantage.
- User Support and Training
IT teams provide technical support to retail employees and ensure that they are trained to use IT systems effectively. This includes troubleshooting hardware and software issues and conducting training programs.
- Disaster Recovery and Business Continuity
Developing and maintaining disaster recovery plans and backup systems is crucial to ensure that retail operations can continue in the event of system failures or unforeseen disasters.
The Information Technology department is responsible for a wide range of tasks that are critical to the efficient and effective operation of the business. Their role extends from managing in-store technology to supporting e-commerce platforms, analyzing data, ensuring security and compliance, and driving innovation to stay competitive in a rapidly evolving industry.
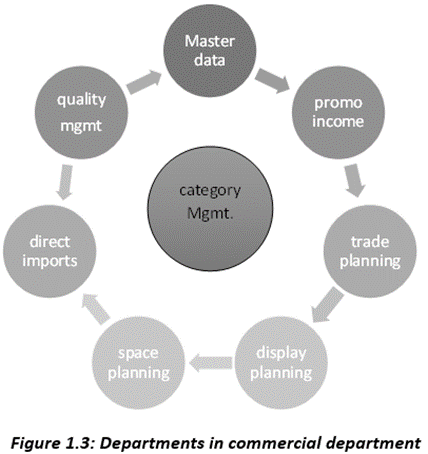
Commercial Department (Category management Department)
The category management department is primarily responsible for developing and managing the category wise, product wise, brand wise, supply wise strategies. This involves negotiations to maximize the commercial gross margin, managing the brand mix (optimizing contribution), buying, managing promotions etc. they are supporting functions within the category management department such as master data management, direct imports, quality management and space and display planning that assist this process.
Revenue Planning Department
The Revenue planning team is responsible for strategizing, maintaining, and developing the FMCG suppliers’ investment portfolio. That promo income team and the category managers are expected to work in tandem to negotiate with FMCG suppliers to purchase supplier facilities such as gondolas, cooler gondolas, tabloids, units etc. once the investments are finalized the promo income team is responsible for execution of the aforementioned facilities in store.
In addition to that the term Revenue planning word itself describing that this team is responsible of exploring new revenue streams that earn more profits other than the main income source of the organization.
Master Data Department
the master data team is responsible for the ERP system (SAP) of the company from a commercial point of view there are responsibilities include listing new items, creating vendors, changing parameters, price changes, product description changes, case size changes etc.
Above described the general functions of these combined departments and with the assistance of Social network analysis tool (Organizational Risk Analysis tool) this report specifically explained about process which these three departments mutually involved.
All the departments included in JayKay Marketing Services, there are three main departments which are directly involved in one main Business process which earns nearly 70 million revenue per month.
- Revenue Planning Department.
- Master Data Department.
- Information Technology Department
As a new initiative Keells retail sector has introduced this KANE (Keells Advanced Network Exchange) vendor portal where suppliers can engage in their usual business-related functions by logging in to a one platform. All the technical tasks related to KANE is carried by information technology and Master data Department and the onboarding process is conducted by Revenue planning Department in achieving this project.
KANE (Keells Advanced Network Exchange) is one of the newest projects by john Keells Holdings which JayKay Marketing Services are taking an attempt to automate their retail business with suppliers.
Previously all the business-related activities with suppliers such as Purchase order management, price changes, new item listings, reactivations, deactivations of codes, invoice transactions etc. conducted manually with the interaction of category management department.
This report explains about the employers and their formal and informal relationships, tasks or the functions, and the knowledge of these departments related to KANE functions after analyzing through Social Network Analysis tool (ORA).
Functions (Tasks) Of the Departments
| Activity |
| Formal communication of KANE with suppliers |
| informing about the compulsory requirement of KANE vendor onboarding to suppliers. |
| sending KANE email templates to suppliers |
| Conducting KANE introductory demonstration to suppliers |
| obtain the official confirmation email of KANE |
| sending supplier to KANE team |
| Freezing master data changes – Communication |
| create the critical path with all tasks and share it with the business |
| Communicate master data freezing period with master data team |
| Communicate master data freezing period with suppliers via CMs |
| Vendor Master |
| Cross check with data available in KANE |
| Share existing data in KANE with master data team for confirmation and required new data for supplier creation in KANE |
| Master data team to provide the required changes for existing data/confirmation / new data |
| Product Master (Including cost and selling price template) |
| Cross check with data available in KANE |
| Share existing data in KANE with master data team for confirmation and required new data for supplier creation in KANE |
| Master data team to provide the required changes for existing data/confirmation / new data |
| Supplier Trainings |
| contact suppliers to schedule time slots to training sessions |
| send the invitations to suppliers |
| Assign user logins for suppliers in Dev |
| Assign KANE team members for each supplier and communicate |
| Conduct training sessions for suppliers (1st session) |
| Master data validation |
| Validate data shared by master data team and do correction if required |
| Share Master templates with Vindhya and migrate through Automated Job – Data Sync |
| Check product mandatory fields in SAP and update SAP with latest information provided by Master data team (if any) |
| Upload data to the system and validate (share NVI and NPI keys with SAP from KANE) |
| Migrate PO, GRN details (data for 3 days prior to go-live date) |
| Maintain ZKAN parameter for vendor POs (JKIT) – vendor codes, PO types |
| Maintain vendor codes in BD64 for parameters |
| Configurations |
| Config vendor and product in SAP |
| Execute a BD10 for full product set |
| Execute ZMM_inforBD10 for full product set (Cost Price) |
| Execute VK13 for full product set (Selling Price) |
| Maintain the new vendor onboard dates for payment t-code |
| Data validation |
| Maintain supplier delivery schedules |
| Validate whether sales data updated for insight |
| Validate whether inventory data updated |
| Create logins for suppliers |
| Start to collect user details to create vendor logins |
| Create logins for suppliers |
| Communicate user login details / SoPs with suppliers |
| Onboard suppliers to the system |
| Onboard and Maintain vendor and customer codes in BD64 for FI documents |
| sending KANE Subscription Agreements to be onboarded suppliers |
| Send and obtain the signed KANE Subscription agreement |
Table 1.1: Functions of the department.
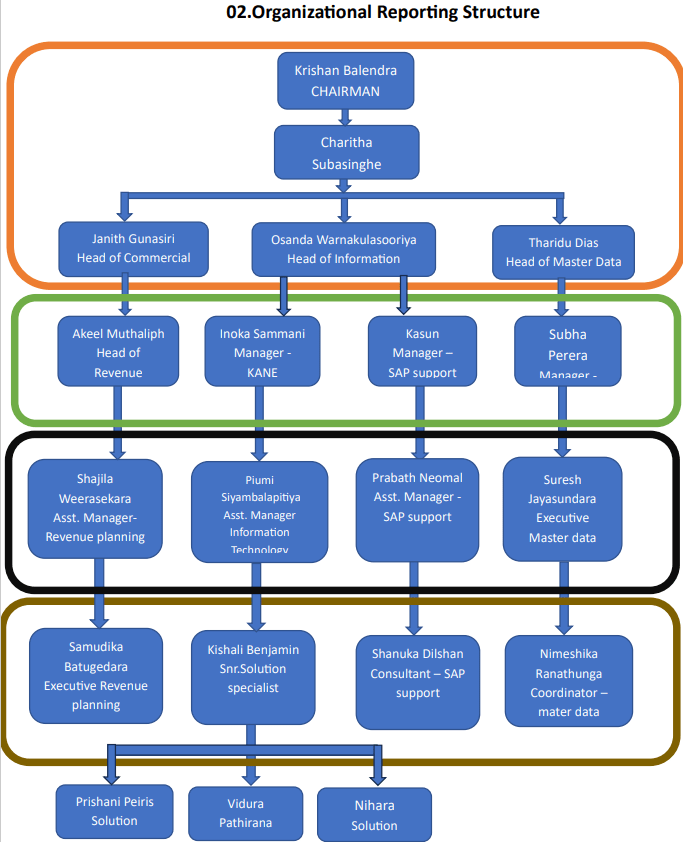
02.Organizational Reporting Structure
03.Lists of nodes
Agent x Agent Formal nodes
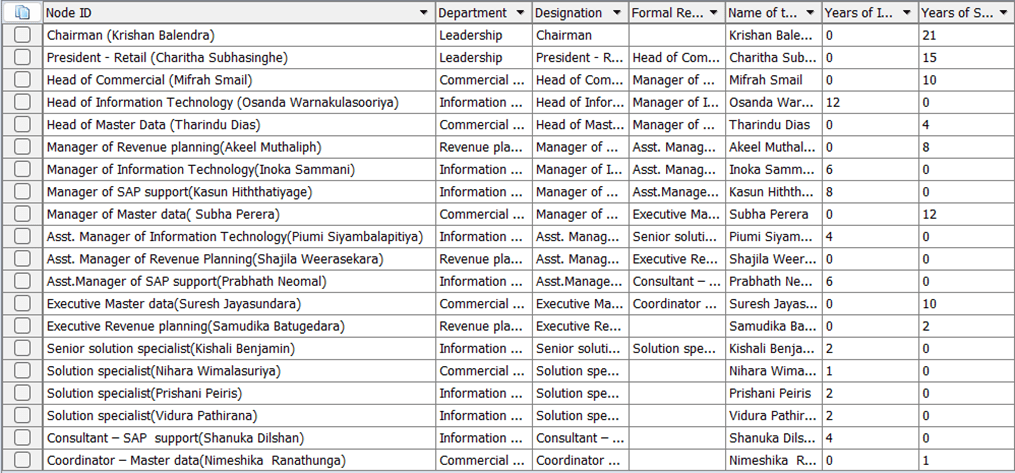
Figure 3.1: Agent x Agent Formal nodes
Agent x Agent Formal Attributes
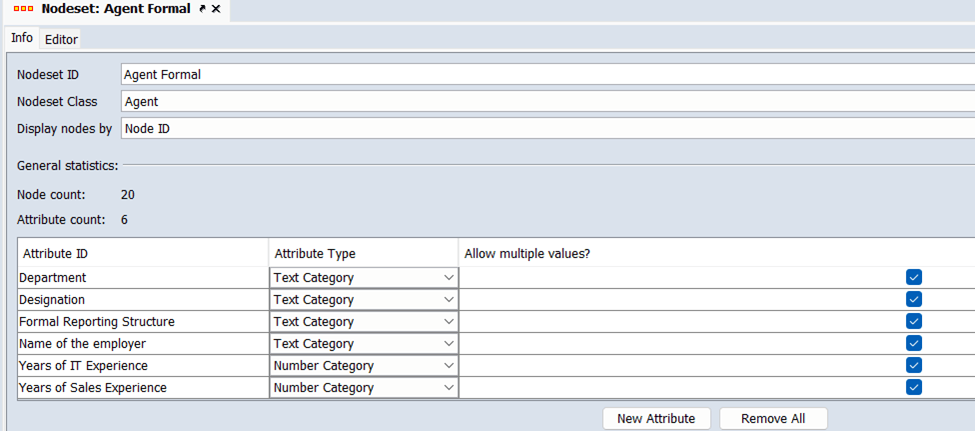
Figure 3.2: Agent x Agent Formal attributes
Agent x Agent Informal nodes
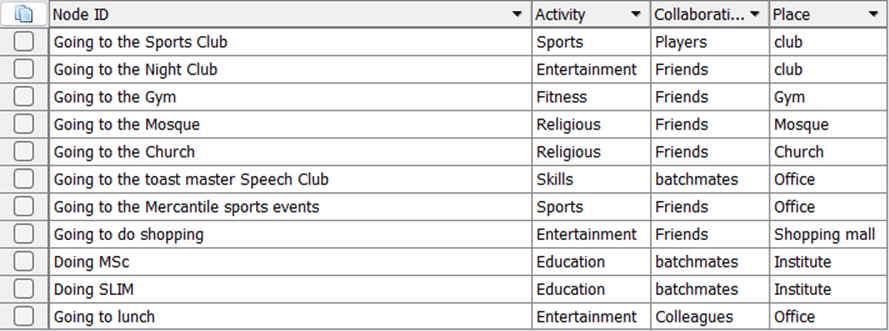
Figure 3.3: Agent x Agent Informal nodes
Agent x Agent Informal attributes
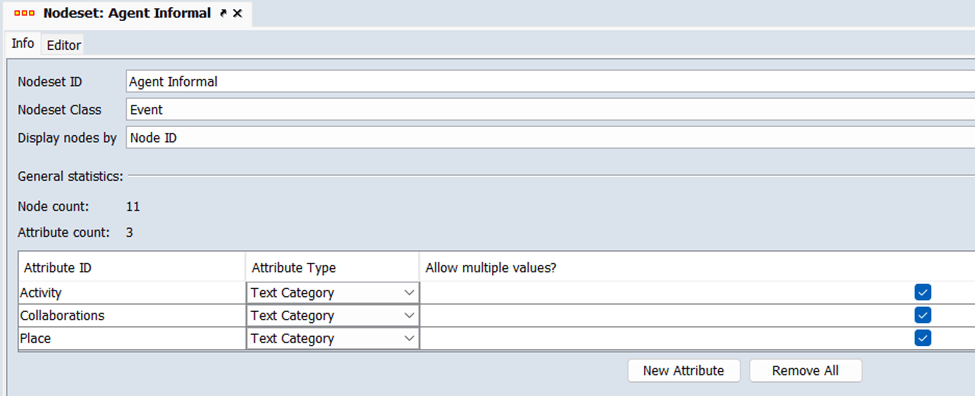
Figure 3.4: Agent x Agent Informal attributes
Agent x Knowledge Nodes
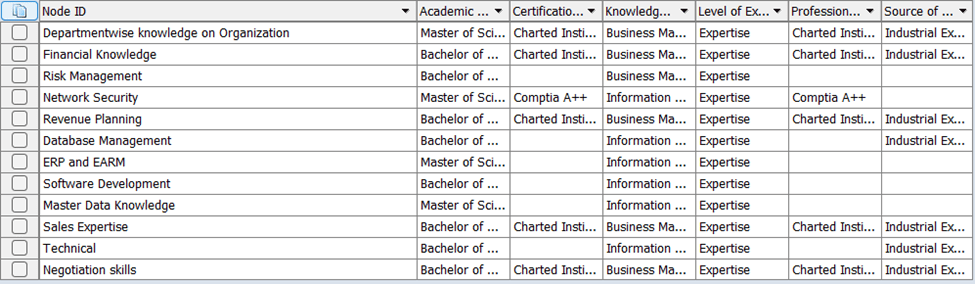
Figure 3.5: Agent x Knowledge nodes
Agent x Knowledge Attributes
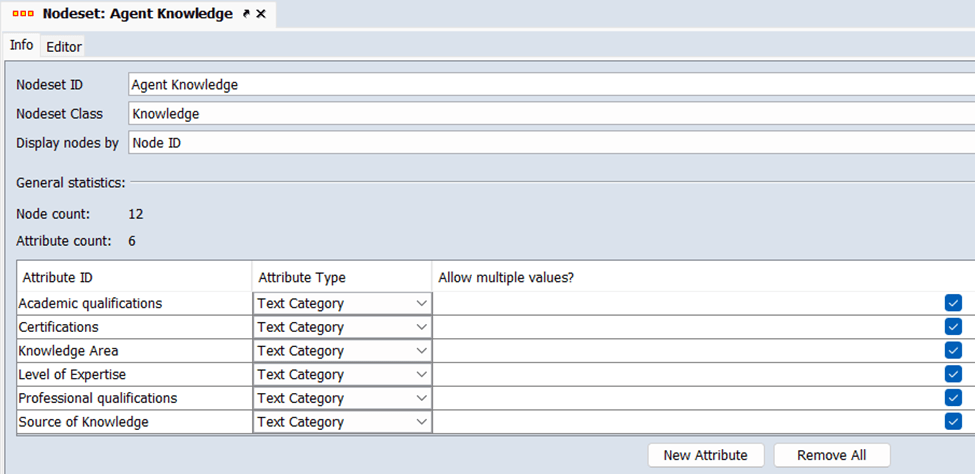
Figure 3.6: Agent x Knowledge attributes
Agent x Agent Task Nodes
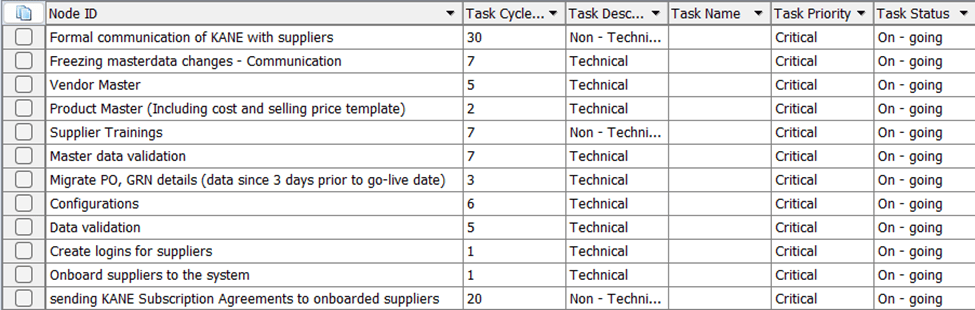
Figure 3.7: Agent x Task nodes
Agent x Agent Task Attributes
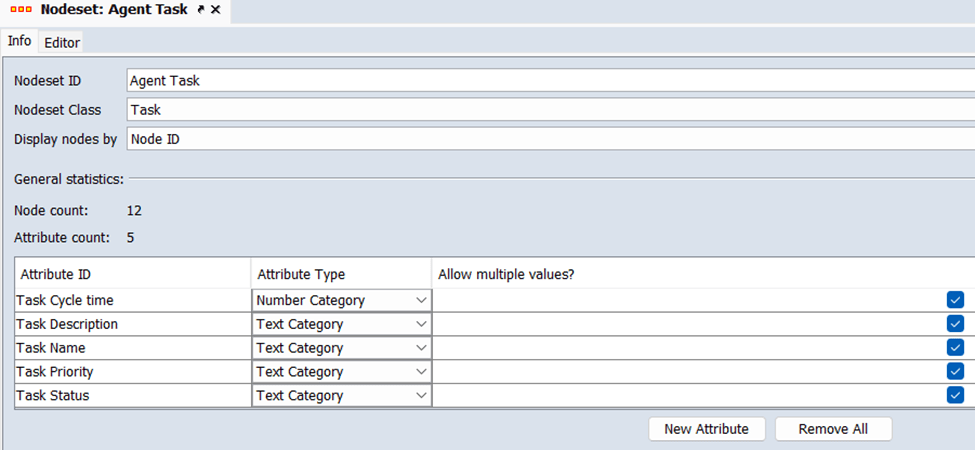
Figure 3.8: Agent x Task attributes
04.Matrices (Grids)
Agent x Agent Formal Matrix
This Agent x Agent Formal is referred to as an adjacency matrix, representing the formal reporting relationships within the Information Technology Department and commercial Department of JayKay Marketing Services (pvt) ltd. Each cell in the matrix indicates whether one agent formally reports to another. Below explained the breakdown of the elements and understanding in interpretation of this matrix.
- Rows and Columns
The matrix has rows and columns, with each row and column representing an agent or individual within the organization. Matrix cells represent if two formal agents have a formal reporting or hierarchical relationship. The order of agents in the rows and columns corresponds to their positions in the organization hierarchy.
- Values (0s and 1s)
The values in the cells of the matrix are binary, taking one of two values:
0 value
This value represents that there is no formal reporting relationship between the agent represented by the row and the agent represented by the column. In other words, it means that the agent in the row does not report to the agent in the column.
1 value
This value represents that there is a formal reporting relationship between the agent represented by the row and the agent represented by the column. In other words, it means that the agent in the row does report to the agent in the column.
- Interpretation
Locate an Agent’s Row
To determine who an agent reports to, examine the agent’s respective row. “1” in any of the columns within that agent’s row, it signifies that the agent in the row has a formal reporting relationship with the agent in that specific column. In other words, the agent in the row reports to the agent(s) in the column(s) marked with “1.”
Locate an Agent’s Column
Conversely, to identify who reports to a particular agent, examine the agent’s corresponding column. If there is a “1” in any of the rows within that agent’s column, it indicates that the agent in the row (represented by the “1”) formally reports to the agent at the top of the column. In this context, the agent in the column is the superior or manager.
By following these steps, it is easy to discern the formal relationships and hierarchy among agents in the organization based on the “0s” and “1s” in the matrix.
- Hierarchy Example
The Chairman (Krishan Balendra) is at the top of the hierarchy and does not report to anyone. Therefore, there are all “0s” in the Chairman’s row.
The President – Retail (Charitha Subhasinghe) has a “1” in the Chairman’s column, indicating that the President reports to the Chairman.
Similar patterns continue down the hierarchy. For instance, the Head of Commercial (Mifrah Smail) reports to the Chairman, as indicated by the “1” in the Chairman’s column in the row corresponding to the Head of Commercial.
- Organizational Formal Structure
This matrix serves as a visual representation of the formal reporting structure within the organization, including who holds leadership positions and the hierarchical relationships between individuals. It serves as a basis for understanding how information and decision-making flow through the hierarchy. It assists clarifying reporting lines, establishing authority, and understanding the hierarchy of leadership positions. Analyzing this matrix can inform decisions related to organizational structure, leadership assignments, and communication flows.
- Analysis
Such matrices are commonly used for organizational analysis, organizational chart creation, and decision-making regarding structural changes or leadership assignments within an organization.
This matrix is a valuable resource for depicting and comprehending the formal structure of an organization.
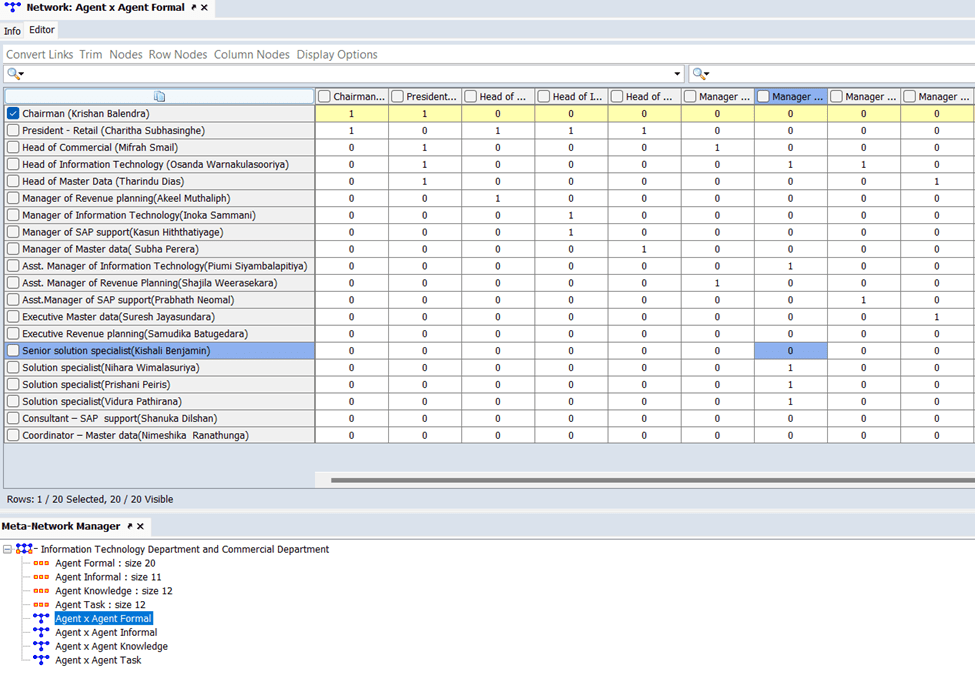
Figure 4.1: Agent x Formal Matrix
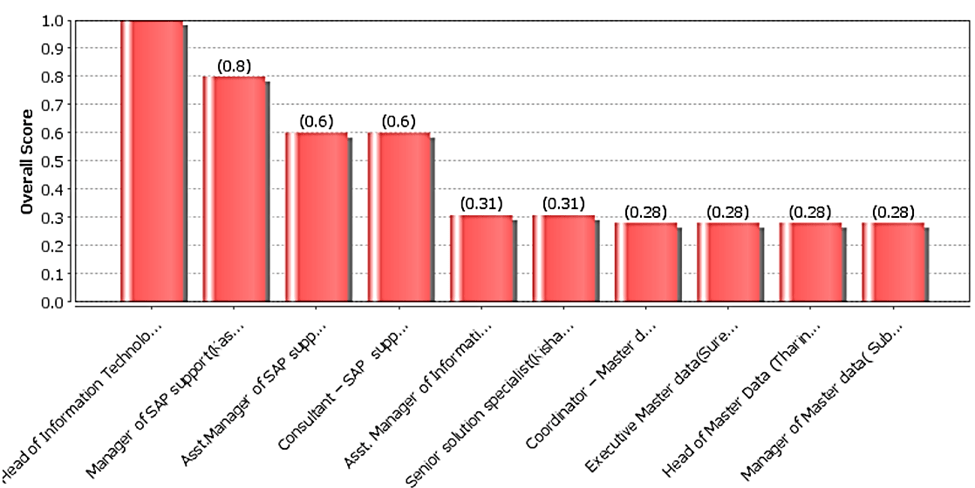
Overall Top-Ranked Agent Formal
This chart shows the Agent Formal nodes that are top-ranked overall using the node-level measures listed below. The value shown for a node is the average of its measure values, each of which is first converted into a z-score. The final scores are then normalized to be between zero and one. There are 20 nodes in the node set.
Agent Formal x Agent Informal Matrix
This matrix provides insights into informal connections among employers within the Information Technology Department and commercial Department of JayKay Marketing Services (pvt) Ltd.
- Rows and Columns
The rows and columns represent agents (individuals or employers) in the departments, and each cell in the matrix indicates whether there is an informal connection between two formal agents. These informal relationships between these agents depict friendships, informal relationships, or any other non-hierarchical interactions.
- Values (0s and 1s)
0 Value
The cells with “0” represent the absence of informal reporting relationships. In other words, “0″ in a cell where the row agent intersects with the column agent, it means there is no informal relationship or friendship between those two individuals.
1 value
The cells with “1” indicate the presence of informal connections between individuals. These informal connections can take various forms, such as friendships, collaborations, or other non-hierarchical relationships.
- Interpretation
value “1” in the cell where The President – Retail (Charitha Subhasinghe) intersects with ” the Head of Commercial (Mifrah Smail) ” it signifies that there is an observed informal connection or relationship between these two employers where they both are going to sports club together within the department. This connection might involve shared interests, collaboration on projects, or any other non-formal interaction.
- Organizational Informal Structure
The matrix helps in understanding not only the formal reporting structure but also the informal social network within the organization. Analyzing this matrix can provide insights into how informal connections impact work dynamics, knowledge sharing, and collaboration among team members.
- Analysis
This matrix highlights the coexistence of formal and informal relationships among individuals in your department, shedding light on the broader social network dynamics alongside the established reporting structure.
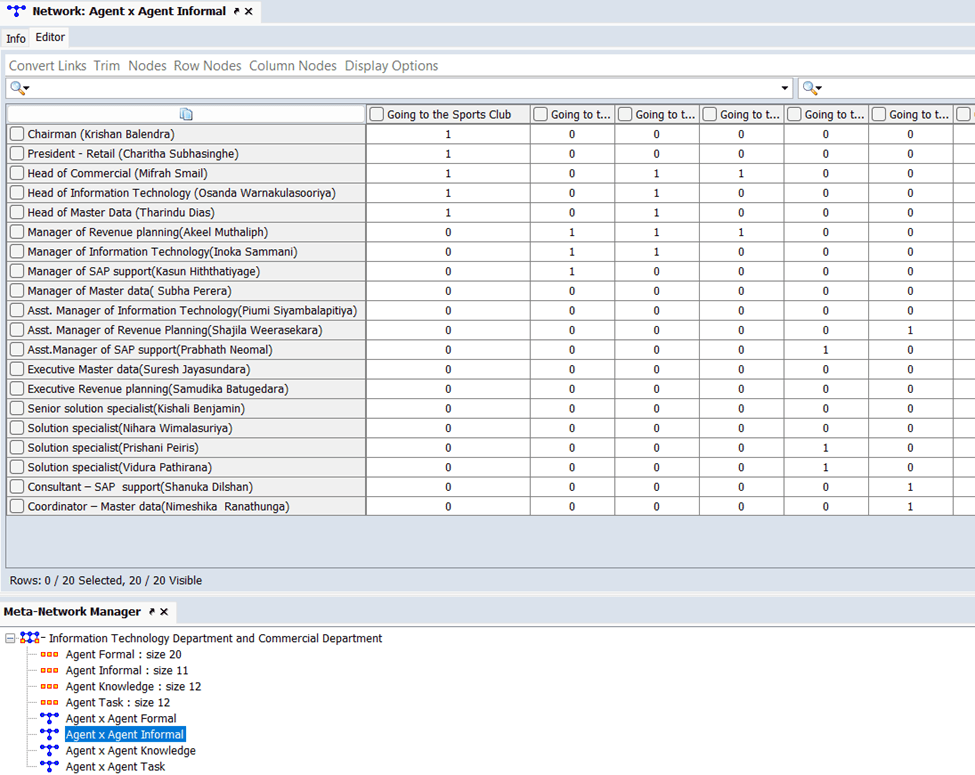
Figure 4.2: Agent x Agent Informal Matrix
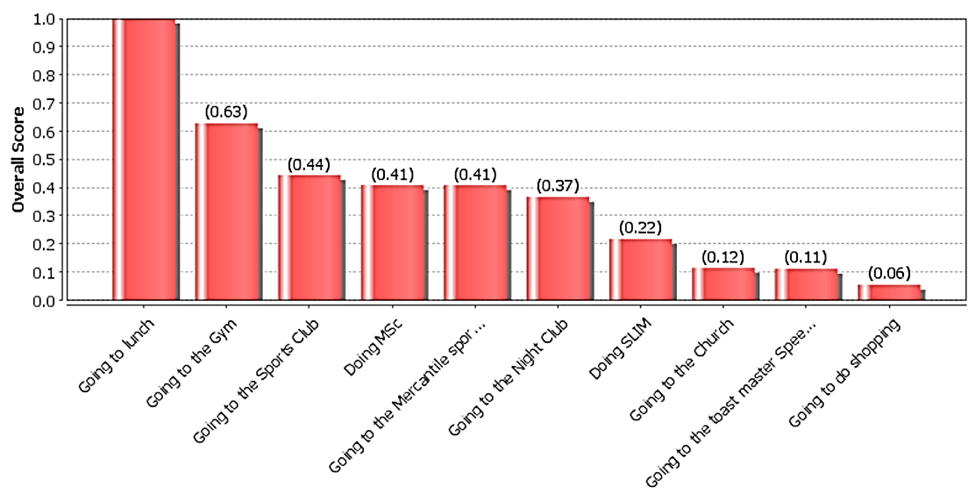
Overall Top-Ranked Agent Informal
This chart shows the Agent Informal nodes that are top-ranked overall using the node-level measures listed below. The value shown for a node is the average of its measure values, each of which is first converted into a z-score. The final scores are then normalized to be between zero and one. There are 11 nodes in the node set.
Agent x Knowledge Matrix
This matrix provides a comprehensive overview of the knowledge distribution among the employers(agents) within the Information Technology Department and commercial Department of JayKay Marketing Services (pvt) Ltd.
- Rows and Columns
The rows represent different agents, or individuals, while the columns correspond to various knowledge areas or domains relevant to the department. Each cell in the matrix indicates the level of knowledge possessed by a particular agent(employer) in a specific domain.
Agent (Row)
Each row represents an agent or individual within the organization, such as Chairman Krishan Balendra, President – Retail Charitha Subhasinghe, and others.
Knowledge Area (Column)
Each column represents a specific knowledge area or domain relevant to specific department, including Department wise knowledge on Organization, Financial Knowledge, Risk Management, Network Security, Revenue Planning, Database Management, ERP and EARM, Software Development, Master Data Knowledge, Sales Expertise, Technical, and Negotiation skills.
- Values (0s and 1s)
The values in each cell of the matrix indicate the level of knowledge an agent possesses in a particular knowledge area. The values can range from 0 to 1, where.
0 indicates little to no knowledge or expertise in the respective domain.
1 indicates a significant level of knowledge or expertise in the respective domain.
- Interpretation
Value “1” in the cell where “Chairman Krishan Balendra” intersects with “Financial Knowledge,” it signifies that Chairman Krishan Balendra possesses a substantial level of financial knowledge. Conversely, value “0” in the same cell, it would indicate that Chairman Krishan Balendra does not possess significant knowledge in the financial domain.
- Organizational knowledge Structure
This matrix serves as a valuable resource for assessing the knowledge strengths and gaps within the organization. It enables us to identify individuals with expertise in specific areas and those who may benefit from further training or collaboration in certain domains. Additionally, it assists in making informed decisions regarding knowledge-sharing initiatives, project assignments, and skill development strategies.
- Analysis
The Agent x Knowledge matrix offers a clear and concise representation of the knowledge distribution among our team members, facilitating effective knowledge management and decision-making processes.
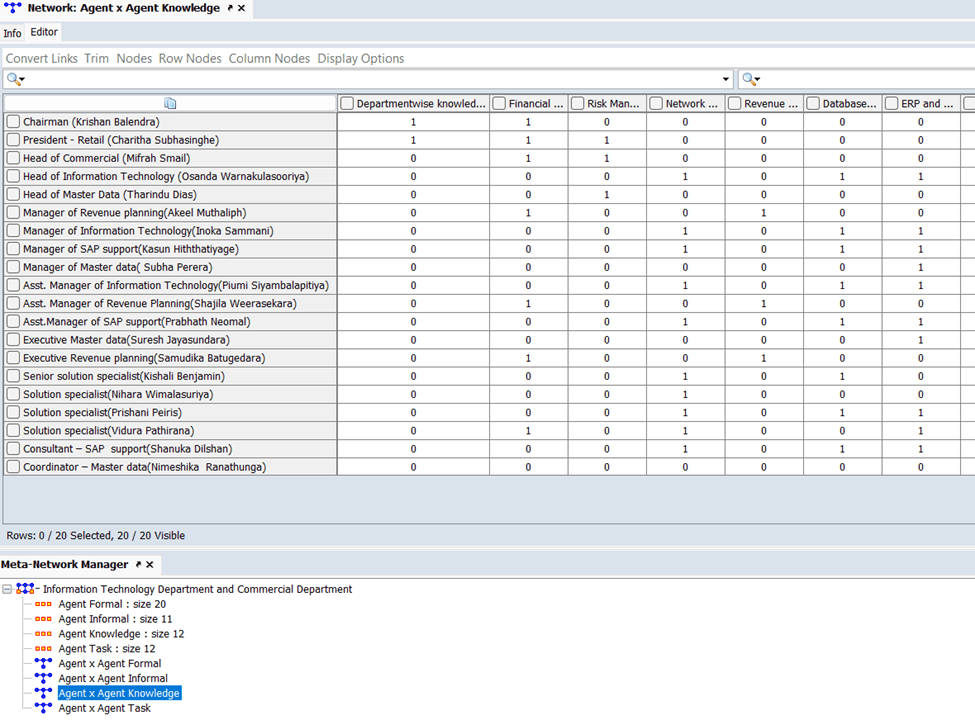
Figure 4.3: Agent x Knowledge Matrix
Overall Top-Ranked Agent Knowledge
This chart shows the Agent Knowledge nodes that are top-ranked overall using the node-level measures listed below. The value shown for a node is the average of its measure values, each of which is first converted into a z-score. The final scores are then normalized to be between zero and one. There are 12 nodes in the node set.

Agent x Task Matrix
This matrix provides an overview of the tasks and responsibilities assigned to various individuals or employers within the Information Technology Department and commercial Department of JayKay Marketing Services (pvt) Ltd.
- Rows and Columns
The rows represent different agents or employers, while the columns correspond to specific tasks or activities that are part of our operations. Each cell in the matrix indicates whether an agent is responsible for or involved in a particular task.
Agent (Row)
Each row represents an agent or individual within our organization, including Chairman Krishan Balendra, President – Retail Charitha Subhasinghe, and others.
Task (Column)
Each column represents a specific task or activity relevant to a department’s functioning. Tasks include “Formal communication of KANE with suppliers,” “Freezing master data changes – Communication,” “Vendor Master,” “Product Master (Including cost and selling price template),” “Supplier Trainings,” “Master data validation,” “Migrate PO, GRN details (data since 3 days prior to go-live date),” “Configurations,” “Data validation,” “Create logins for suppliers,” “Onboard suppliers to the system,” and “sending KANE Subscription Agreements to onboarded suppliers.”
- Values (0s and 1s)
The values in each cell of the matrix indicate an agent’s involvement or responsibility level for a specific task. The values can be either “0” or “1,” where:
“0” indicates that the agent is not responsible for or involved in the corresponding task.
“1” indicates that the agent is responsible for or involved in the corresponding task.
- Interpretation
For example, value “1” in the cell where “Chairman Krishan Balendra” intersects with “Formal communication of KANE with suppliers,” it signifies that Chairman Krishan Balendra is responsible for formal communication with suppliers regarding KANE. Conversely, value “0” in the same cell, it would indicate that Chairman Krishan Balendra is not directly responsible for this task.
- Organization functional Structure
This matrix helps to clarify the allocation of tasks and responsibilities within our organization, ensuring that each task is assigned to the appropriate individuals or roles. It aids in streamlining communication and coordination by providing a clear overview of who is accountable for specific activities. Additionally, it can serve as a valuable reference for task management, project planning, and ensuring that our operations run smoothly.
- Analysis
The Agent x Task matrix offers a structured view of task assignments and responsibilities among our team members, promoting efficient task management and collaboration within our organization.
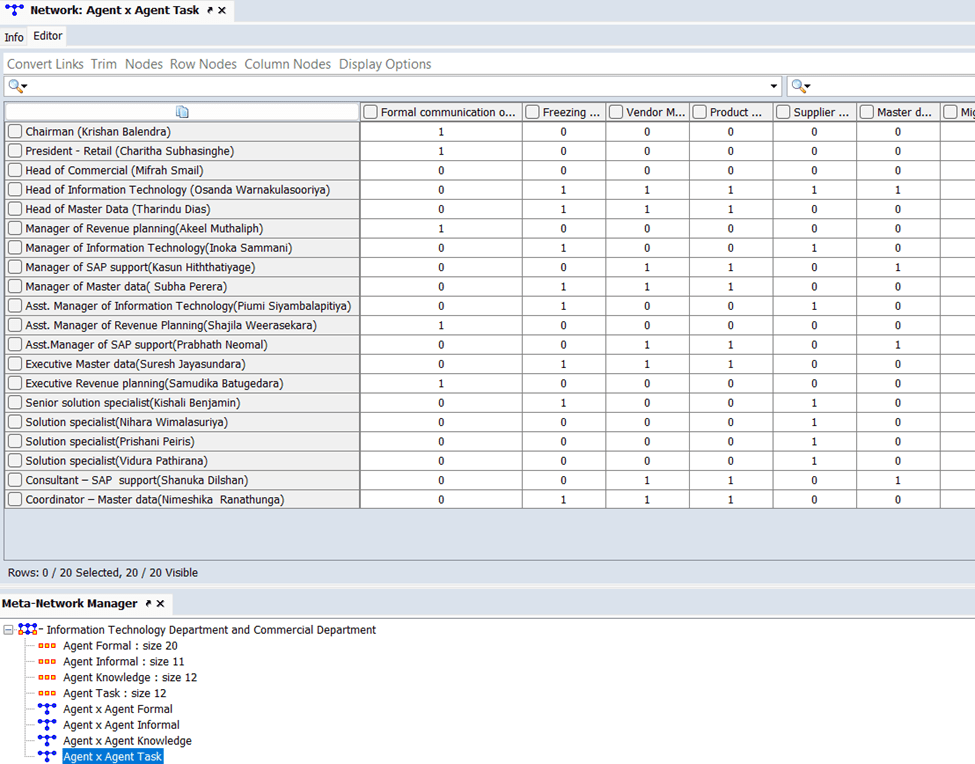
Figure 4.4: Agent x Task Matrix
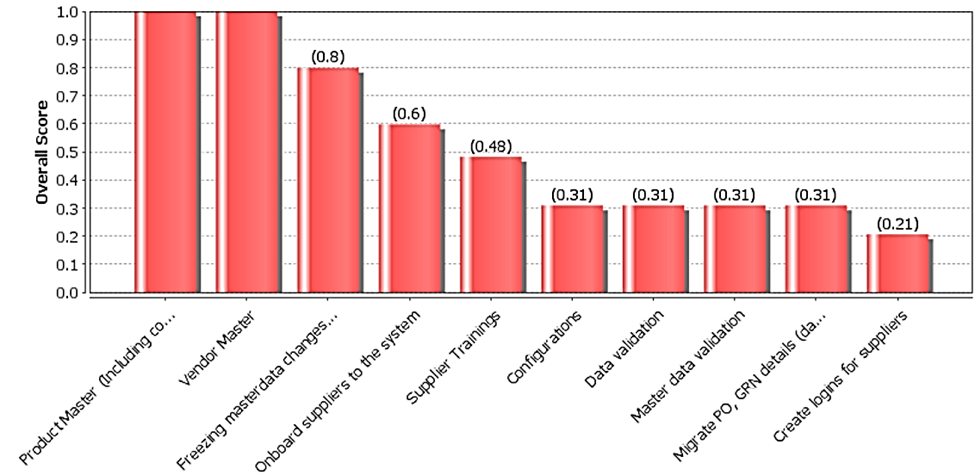
Overall Top-Ranked Agent Task
This chart shows the Agent Task nodes that are top-ranked overall using the node-level measures listed below. The value shown for a node is the average of its measure values, each of which is first converted into a z-score. The final scores are then normalized to be between zero and one. There are 12 nodes in the node set.
05.Visualization of 4 networks and combined meta network.
Combined Meta Network.
- Agent x Agent Formal
- Agent x Agent Informal
- Agent x Knowledge
- Agent x Task

Figure 5.1: Combined Meta Network
Agent x Agent Formal Network.
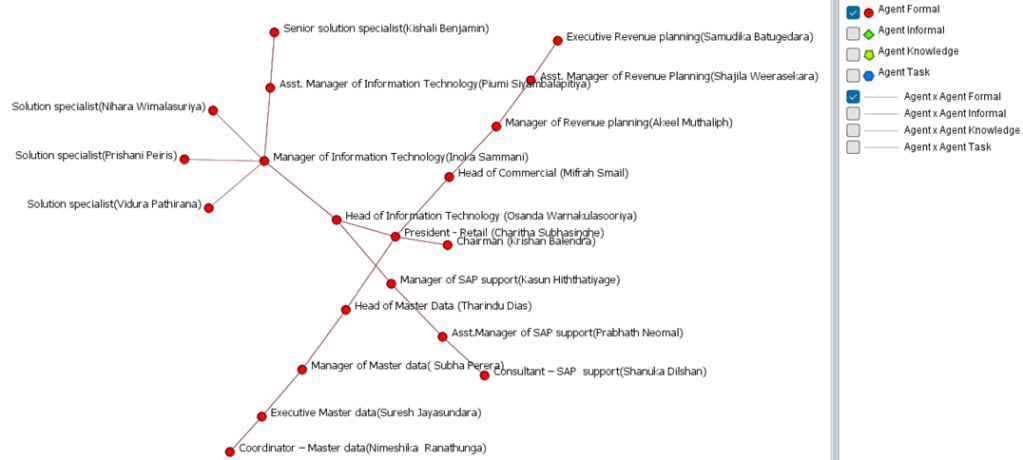
Figure 5.2: Agent x Agent Formal Network.
Agent x Agent Informal Network.
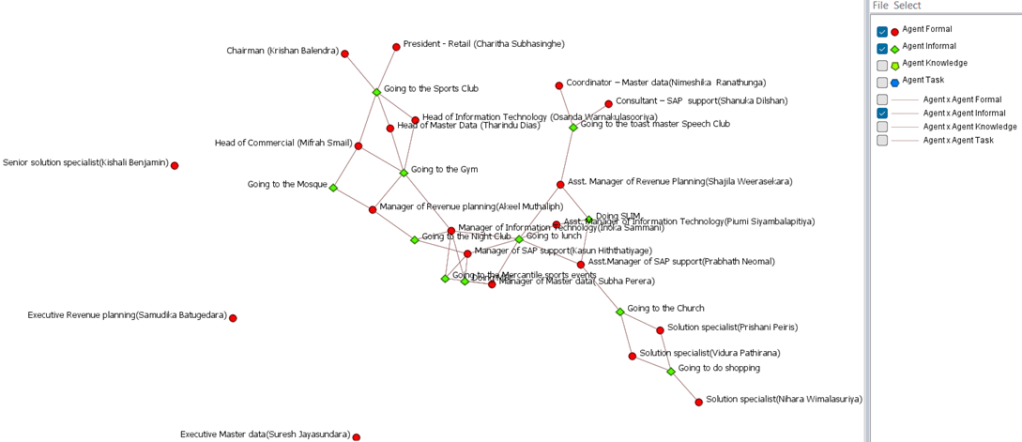
Figure 5.3: Agent x Agent Informal Network.
Agent x Knowledge Network.
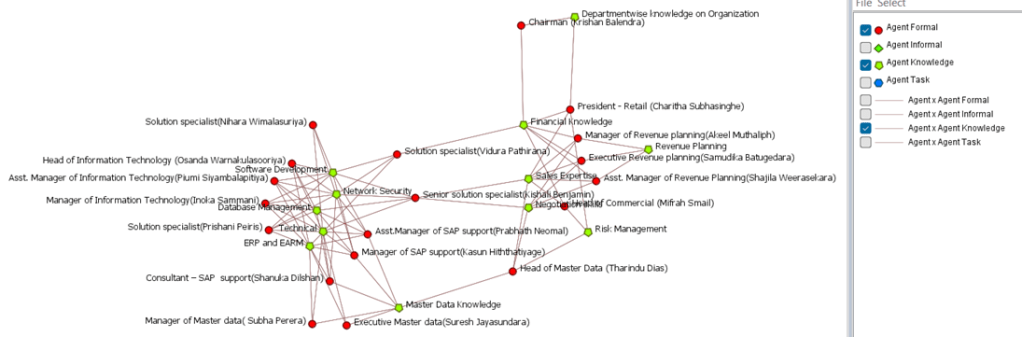
Figure 5.4: Agent x Knowledge Network.
Agent x Task Network.

Figure 5.5: Agent x Task Network.
06.Node-Wise (Agent) Measurements of Total degree, Closeness & Betweenness
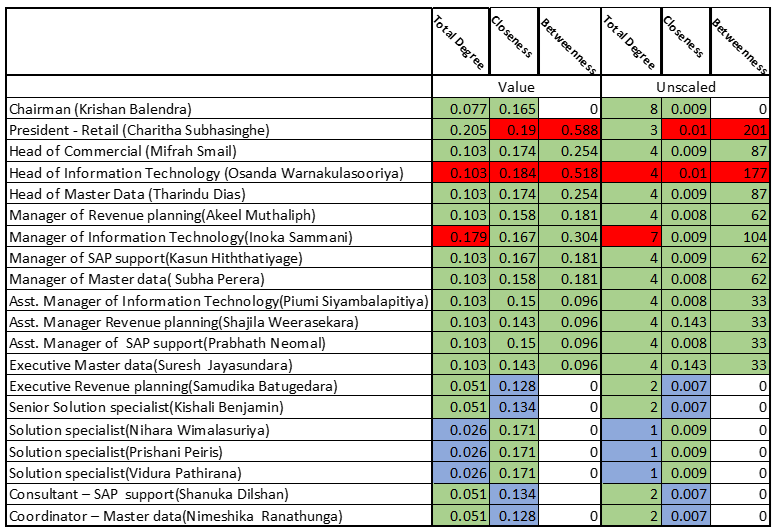
Table 6.6: node-wise (Agent) measurements of Total degree, Closeness & Betweenness
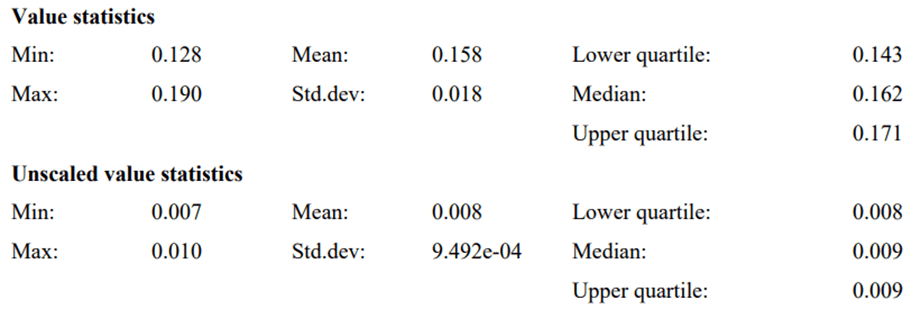
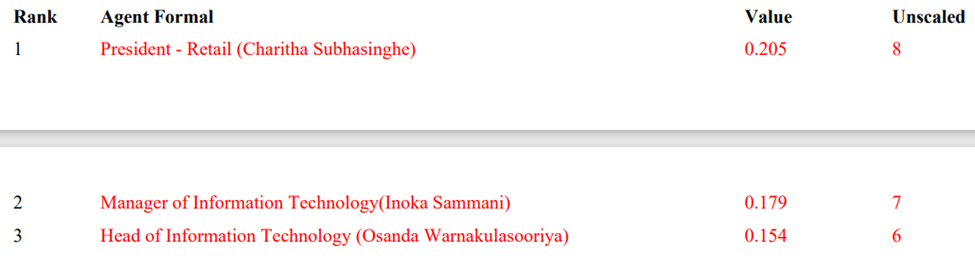
Centrality, Total-Degree
Individuals or organizations who are ‘in the know’ are those who are linked to many others and so, by virtue of their position, have access to the ideas, thoughts, beliefs of many others. Individuals who are ‘in the know’ are identified by degree centrality in the relevant social network. Those who are ranked high on these metrics have more connections to others in the same network. The scientific name of this measure is total degree centrality, and it is calculated on the agent-by-agent matrices.
Total Degree measures the overall number of connections, both incoming and outgoing, for each agent in the network. It essentially shows how well-connected an agent is within the network. President (Retail) Charitha Subasinghe has the highest Total Degree (0.205) in this dataset, indicating that it possesses the most connections within the network.
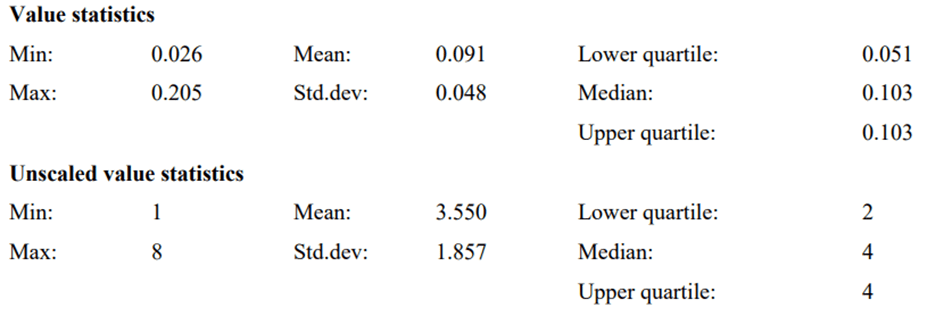
If the node of interest has a higher-than-normal value (greater than 1 standard deviation(s) above the mean) the row is colored red. The row is green if the node is within 1 standard deviation of the mean. Finally, the row is colored blue if the node has a lower-than-normal value (less than one standard deviation(s) below the mean).
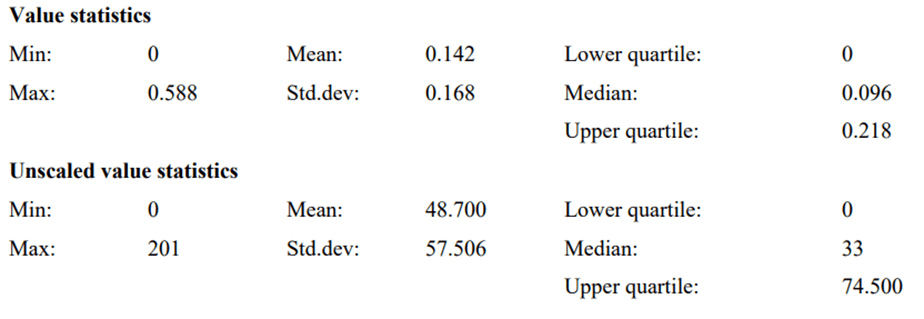
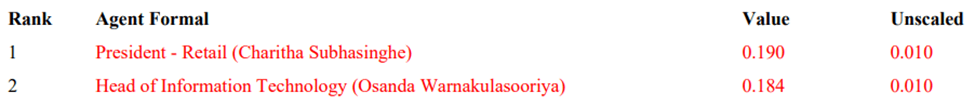
Centrality, Closeness
The closeness of a node to the other nodes in a network (also called out-closeness). Loosely, Closeness is the inverse of the sum of distances in the network from a node to all other nodes.
Closeness Centrality calculates how close or connected an agent is to all other agents in the network. This metric reflects how quickly an agent can communicate or interact with others. Agent Head of Information Technology (Osanda warnakulasooriya) holds the highest Closeness Centrality (0.184), signifying that it occupies a central position in the network, making it efficient for communication with other agents.
If the node of interest has a higher-than-normal value (greater than 1 standard deviation(s) above the mean) the row is colored red. The row is green if the node is within 1 standard deviation of the mean. Finally, the row is colored blue if the node has a lower-than-normal value (less than one standard deviation(s) below the mean).
Centrality, Betweenness
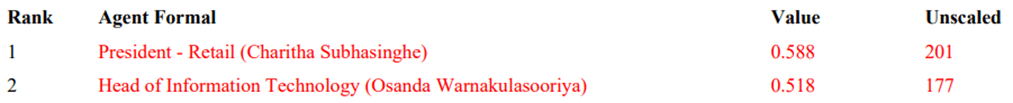
The Betweenness Centrality of node v in a network is defined as: across all node pairs that have a shortest path containing v, the percentage that pass-through v. When the data is weighted, the higher the weight the more value the link has. Individuals or organizations that are potentially influential are positioned to broker connections between groups and to bring to bear the influence of one group on another or serve as a gatekeeper between groups. This agent occurs on many of the shortest paths between other agents. The scientific name of this measure is betweenness centrality and it is calculated on agent-by-agent matrices.
Betweenness Centrality measures the extent to which an agent is strategically positioned along the shortest paths between other agents in the network. It assesses an agent’s influence over the flow of information or interactions among others. President (Retail) Charitha Subasinghe has the highest Betweenness Centrality (0.588), indicating that it acts as a mediator or bridge between other agents, playing a key role in connecting different parts of the network.
If the node of interest has a higher-than-normal value (greater than 1 standard deviation(s) above the mean) the row is colored red. The row is green if the node is within 1 standard deviation of the mean. Finally, the row is colored blue if the node has a lower-than-normal value (less than one standard deviation(s) below the mean)
07.Interpretation and Explanation of insights
Interpretations from Visualizations.
Formal Hierarchy
The formal network clearly outlines a structured hierarchy within the Information Technology Department and Commercial Department. Each agent adheres to a formal reporting system where they report to a direct supervisor, creating an organized chain of command.
Informal Collaboration
In the informal network, there are significant informal connections among agents. These connections facilitate collaboration, information sharing, and mutual support among team members, outside the confines of formal reporting structures.
Knowledge Specialization and expertise.
Agents possess a combination of overlapping and specialized knowledge areas, such as master data, enterprise resources planning and Database management. This diversity of expertise allows them to make valuable contributions to a wide range of projects effectively and efficiently.
Task Flexibility and versality
Agents are assigned to a variety of responsibilities, and some of them handle multiple tasks. This showcases their adaptability and versatility in handling different roles and responsibilities within the department.
Optimizing Resource Allocation
Understanding how tasks are distributed among team members can assist managers in efficiently assigning workloads and making the best use of available resources.
Comprehensive Insight
The integrated meta-network offers a complete view of the departments’ dynamics, encompassing formal and informal relationships, knowledge sharing, and task coordination.
Key Individuals
Within this comprehensive view, certain team members emerge as central figures, highlighting their crucial involvement in various aspects of the department’s operations.
Facilitators of Collaboration
Agents who serve as bridge builders, connecting different parts of the network, play a vital role in enabling cross-functional cooperation and the success of projects.
Fostering Growth
Identifying individuals with the potential to expand their network connections opens up opportunities for professional development and strengthens collaboration within the IT Department.
These insights provide valuable guidance for making strategic decisions regarding resource management, team composition, and promoting a culture of collaboration within the IT Department. Ultimately, these measures aim to enhance the departments’ overall efficiency and effectiveness.
Explanations from Node-Wise Measures.
Nodewise measurement interpretation for Closeness Centrality, Contribution (Eigenvector Centrality), Total-Degree Centrality, and Betweenness Centrality for agents in a network is explained below. Comparison on these centrality measures will give a comprehensive understanding of the network’s structure.
Closeness Centrality
Charitha Subhasinghe, Osanda Warnakulasooriya, and Mifrah Smail are the top-ranking agents in terms of Closeness Centrality.
These agents have high Closeness Centrality values, indicating that they are closely connected to other agents in the network in terms of communication and information flow.
However, Closeness of all agent Centrality values are within 1 standard deviation of the mean, suggesting a moderate level of connectedness among all agents.
Contribution (Eigenvector Centrality
Inoka Sammani, Osanda Warnakulasooriya, and Charitha Subhasinghe rank highest in Contribution (Eigenvector Centrality).
Inoka Sammani stands out with the highest Contribution value, indicating her significant influence in the network.
Similar to Closeness Centrality, some agents have Contribution values within 1 standard deviation of the mean, indicating moderate influence, while others have considerably higher values, signifying their prominent roles in the network.
Total-Degree Centrality
Charitha Subhasinghe, Inoka Sammani, and Osanda Warnakulasooriya are the agents with the highest Total-Degree Centrality.
These agents have many connections within the network, making them central figures with access to various ideas and information sources.
The Total-Degree Centrality values show a similar pattern to Contribution and Closeness Centrality, with some agents having values within 1 standard deviation of the mean and others having notably higher values.
Betweenness Centrality
Charitha Subhasinghe and Osanda Warnakulasooriya have the highest Betweenness Centrality, indicating that they play critical roles in connecting different groups or agents in the network.
In this measure, President – Retail (Charitha Subhasinghe) stands out as the agent with the highest Betweenness Centrality, highlighting her potential to broker connections and serve as a gatekeeper between groups.
Other agents also have varying degrees of Betweenness Centrality, suggesting their roles in facilitating communication and influence between different parts of the network.
Comparison
Inoka Sammani consistently ranks highly across Closeness Centrality, Contribution, and Total-Degree Centrality, indicating her critical role in the network.
Charitha Subhasinghe and Osanda Warnakulasooriya are prominent in all four centrality measures, emphasizing their significance and influence.
Closeness Centrality and Contribution measures highlight the centrality and influence of certain agents, while Total-Degree Centrality underscores the breadth of their connections.
Betweenness Centrality identifies agents who serve as bridges between different parts of the network and play crucial roles in facilitating communication.
President – Retail (Charitha Subhasinghe) holds a pivotal position in the network due to its high Closeness Centrality (0.190) and significant Betweenness Centrality (0.588). This suggests that Agent 02 is crucial for facilitating information flow and communication among other agents. Manager of Information Technology (Inoka Sammani) boasts the second highest Total Degree (0.179), signifying that it has a substantial number of network connections within the executive level. However, its Closeness Centrality, while respectable (0.167), suggests that it might not be positioned at the very center in terms of communication efficiency. Solution specialists Niahara, Prishani and Vidura despite having fewer network connections (Total Degree less than 0.230), maintain relatively high Closeness Centrality scores (above 0.170). This indicates that they are effective communicators within the network.
These centrality metrics shed light on the roles and impact of each agent within the network, aiding in the identification of central communicators, connectors, and agents with fewer connections.
In summary, these centrality measures collectively provide a comprehensive view of the network’s structure and the roles of individual agents. While some agents excel in one measure more than others, the comparison reveals a nuanced understanding of their centrality, influence, and connectivity within the network, as well as their potential to act as intermediaries and connectors.
08.Risks and Opportunities within the department.
Risks
Analyzing the risk of these two departments using measures obtained through the measures report involves assessing various network metrics and patterns to identify potential issues or vulnerabilities. Below are some of the measures mentioned earlier that can be used to analyze risk, along with justifications for their relevance.
Total Degree
Analysis
Total Degree measures the total number of connections for each agent. A low Total Degree for a critical department member may indicate isolation from the network, potentially posing a risk if this person holds important knowledge or responsibilities.
Justification
In the above data three main employees have many connections when compared to other employees. If a key employee has few connections, the risk lies in their potential to become a single point of failure. If they leave the organization or are unavailable, it could disrupt operations.
Closeness Centrality
Analysis
Closeness Centrality quantifies how quickly an agent can reach all other agents in the network. Low Closeness Centrality for a central department member might indicate that they are not efficiently connected to others.
Justification
Although the chairperson for these two departments has a strong relationship with the head of Information Technology and head of Commercial department, assistant managers and executives have a very low degree of formal relationship towards the chairperson which would be a potential risk.
If a central figure cannot efficiently communicate with others, it can lead to delays in decision-making and problem-solving, potentially risking operational efficiency.
Betweenness Centrality
Analysis
Betweenness Centrality identifies agents who act as mediators in the network. If a department member with high Betweenness Centrality is overloaded, it may suggest a risk of bottleneck in information flow.
Justification
In this Head of Information Technology who is an overloaded mediators can slow down the exchange of critical information. In a fast-paced environment, this bottleneck can hinder timely responses to emerging issues.
Informal Collaboration
Analysis
The presence of strong informal connections indicates high collaboration. If these connections are limited among certain department members, it could signal potential communication issues or silos.
Justification
Departments with isolated subgroups can face challenges in sharing vital information or collaborating on projects, which can increase the risk of misunderstandings or duplication of efforts.
Task Versatility
Analysis
Assessing the versatility of tasks assigned to department members can reveal potential risks in terms of workload distribution. If some employees are overloaded with multiple tasks, it may indicate a risk of burnout or decreased productivity.
Justification
Overburdened employees are more likely to make errors, leading to operational inefficiencies and potential disruptions.
Knowledge Expertise
Analysis
Evaluating the distribution of specialized knowledge can highlight the risk associated with knowledge concentration. If key knowledge is concentrated in a few individuals, the risk of knowledge loss due to turnover or absence increases.
Justification
In cases of sudden departures or long absences of knowledgeable employees, there is a risk of losing critical knowledge, potentially affecting project timelines and quality.
provide a comprehensive view of the risks and vulnerabilities within a department’s social network, helping organizations make informed decisions to mitigate those risks.
Group Cohesion
Justification
Low group cohesion, where subgroups or teams within the department do not collaborate effectively, is a potential risk because it can lead to fragmented communication and information silos.
Risks
Reduced information sharing between subgroups can result in incomplete or outdated knowledge.
Lack of collaboration may lead to duplication of efforts and inefficient use of resources.
Subgroups that do not work well together may result in conflicts or misunderstandings, hindering overall departmental productivity and effectiveness.
Communication Efficiency
Justification
Inefficient communication within the department can pose significant risks to timely decision-making and coordination.
Risks
Delayed decision-making due to slow or ineffective communication channels can impact on the department’s ability to respond promptly to challenges.
Miscommunication or misunderstandings can lead to errors, rework, and reduced productivity.
Bottlenecks in information flow can hinder knowledge sharing and innovation, ultimately affecting the department’s performance.
Network Density
Justification
Low network density, indicating sparse connections within the department’s network, can reveal potential risks related to communication gaps and isolation.
Risks
Sparse connections may mean that certain individuals or teams are not effectively connected to others, leading to limited information sharing.
Isolated individuals or teams may not have access to critical knowledge or resources, hindering their ability to contribute effectively to departmental goals.
Communication gaps can result in a lack of awareness about important updates or changes, potentially causing disruptions.
Change Resilience
Justification
Evaluating the network’s ability to adapt to changes, such as the departure of key members, is crucial for identifying risks related to resilience.
Risks
If the network relies heavily on a few key individuals and lacks redundancy, the departure of these individuals can disrupt workflows and cause knowledge loss.
Inflexible networks that cannot easily adapt to changes in roles or responsibilities may struggle to maintain productivity during transitions.
A lack of succession planning or backup roles can leave the department vulnerable to disruptions caused by unexpected events.
Task Interdependence
Justification
Analyzing task interdependence can uncover potential risks associated with high dependency on critical tasks without backup plans.
Risks
High task interdependence without contingency plans can lead to bottlenecks if a critical task encounter delays or issues.
Lack of backup plans can result in disruptions to project timelines and potentially affect the department’s ability to meet goals.
Overreliance on a single individual or team for a crucial task can be risky if they become unavailable.
Collaboration Patterns
Justification
Studying collaboration patterns can reveal potential risks related to conflicts, inefficient collaboration, or misalignment of goals.
Risks
Conflicts and disagreements among department members can disrupt workflows and create a negative work environment.
Inefficient collaboration may result in projects taking longer to complete or not meeting quality standards.
Lack of alignment on departmental goals can lead to individuals or teams working at cross-purposes, affecting overall departmental effectiveness.
These measures are essential for identifying potential risks within a department’s social network. By addressing these risks proactively, organizations can improve communication, collaboration, and overall departmental performance while mitigating the potential negative impacts highlighted by these measures.
Opportunities
Analyzing opportunities within these two departments using measures involves assessing various measures to identify areas where the departments can capitalize on potential advantages, enhance collaboration, and improve overall performance. Below are measures commonly used to analyze opportunities, along with justifications for their relevance.
Network Density
Measure
Assessing the density of connections within the department’s network.
Justification
High network density indicates that department members are well-connected, which can lead to increased opportunities for collaboration, knowledge sharing, and innovation. A dense network fosters a conducive environment for generating and exploring new ideas and initiatives.
Centrality Metrics (Closeness and Betweenness)
Measure
Evaluating which individuals have high closeness and betweenness centrality.
Justification
Individuals with high closeness centrality can access diverse information quickly, facilitating their ability to identify and seize opportunities. Those with high betweenness centrality act as bridges between different subgroups, making them instrumental in sharing valuable insights and facilitating collaboration.
Group Cohesion
Measure
Analyzing the overall cohesion and subgroup structures within the department.
Justification
Cohesive subgroups can be advantageous for generating and pursuing opportunities. Highly cohesive teams tend to have strong internal communication and can collectively identify and capitalize on opportunities within their domain.
Task Interdependence
Measure
Investigating the interdependence of tasks or projects within the department.
Justification
Identifying tasks with high interdependence can reveal opportunities for streamlining processes, optimizing resource allocation, and leveraging synergies. Recognizing and addressing task interdependencies can lead to more efficient and productive operations.
Communication Efficiency
Measure
Assessing the speed and efficiency of communication.
Justification
Efficient communication ensures that information relevant to opportunities is disseminated promptly. Delays or breakdowns in communication can hinder the department’s ability to recognize and respond to emerging opportunities in a timely manner.
Change Resilience
Measure
Evaluating the network’s ability to adapt to changes.
Justification
A resilient network can readily adapt to changes in the external environment or internal dynamics. This adaptability is crucial for seizing opportunities that may arise unexpectedly or in response to shifting market conditions.
Collaboration Patterns
Measure
Studying collaboration patterns among department members.
Justification
Analyzing collaboration patterns can highlight areas where collaboration can be enhanced to capitalize on collective expertise and creativity. Inefficient collaboration patterns may represent missed opportunities for joint problem-solving or innovation.
In summary, these measures provide valuable insights into the opportunities within a department’s social network. High network density, centrality of key individuals, cohesive subgroups, efficient communication, adaptability to change, and effective collaboration patterns all contribute to the department’s ability to identify, pursue, and leverage opportunities for growth and improvement. Analyzing these measures collectively helps organizations make informed decisions to harness their full potential.
09.Recommendations
Based on the analysis of risks and opportunities within the departments using social network analysis measures, here are some recommendations to improve the department’s performance and mitigate potential risks
Recommendations to Mitigate Risks
- Enhance Communication Efficiency
Implement tools and practices that facilitate quicker and more efficient communication within the department.
Encourage regular status updates and clear communication channels to prevent miscommunication or bottlenecks.
- Address Network Gaps
Identify individuals or subgroups with limited connections and take steps to integrate them into the network.
Promote cross-functional projects or training sessions to encourage interaction between isolated groups.
- Strengthen Change Resilience
Foster a culture of adaptability by encouraging employees to embrace change and new opportunities.
Develop contingency plans to mitigate the impact of key personnel departures or other disruptions.
- Optimize Task Interdependence
Identify critical tasks with high interdependence and establish backup plans or redundancy where necessary.
Streamline workflows and processes to minimize dependencies and enhance efficiency.
- Promote Collaboration Patterns
Facilitate cross-functional collaboration through workshops, brainstorming sessions, or interdisciplinary projects.
Encourage knowledge sharing and joint problem-solving to leverage the collective expertise of the department.
Recommendations to Capitalize on Opportunities
- Leverage High Network Density
Identify areas where high network density can be utilized to drive innovation and collaboration.
Encourage knowledge sharing platforms and cross-functional teams to harness the potential of a well-connected network.
- Empower Centrally Positioned Individuals
Recognize and support individuals with high centrality (closeness and betweenness) by entrusting them with critical roles.
Utilize their ability to access information and bridge gaps to drive initiatives and seize opportunities.
- Cultivate Group Cohesion
Foster collaboration and unity within cohesive subgroups.
Empower these subgroups to take ownership of specific projects or opportunities aligned with their expertise.
- Facilitate Efficient Communication
Implement tools and practices to further improve communication efficiency.
Ensure that important updates and opportunities are promptly shared with relevant team members.
- Promote Adaptability and Change Readiness
Continuously assess the department’s adaptability to changing circumstances.
Encourage a proactive approach to identifying and capitalizing on emerging opportunities.
- Optimize Collaboration
Analyze collaboration patterns and identify areas for improvement.
Provide training or resources to enhance effective collaboration and information sharing.
These recommendations aim to create a balanced approach, addressing both risks and opportunities within the department’s social network. By implementing these strategies, the department can enhance its performance, foster innovation, and effectively respond to changing circumstances in a rapidly evolving business environment.

Leave a comment